A scale which quantifies the effects of intermixture between the Northern European or Nordish race and other races, and thus the relative assimilability of other races by the Nordish race, provides a useful tool for Nordish racial preservationists. This scale is designed to help Nordish preservationists predict the results of intermixture in much the same manner as the periodic table of the elements helps scientists understand chemical reactions. It enables us to calculate the effect on the Nordish race of intermixture with different races, and thus the ability of a Nordish population to assimilate other racial elements. Also, expressing the requirements for Nordish racial preservation in quantitative terms creates an objective standard by which the preservationist effectiveness of different proposals for racial separation can be measured, compared and judged. The larger the numbers involved the more accurate the predicted result or effect will be. The results for individual cases or small samples of intermixture will vary more broadly, but the result for a larger number, especially an entire population, can be predicted with a high degree of accuracy. When the consequences of racial intermixture are quantified, or graphically displayed on a scale or chart, they become clearer, more obvious and easier for many people to understand. There is an inflexibility or absoluteness about numbers that makes them more difficult to evade or deny.
Every scale must have a point of reference, from which the measurement is made. For this scale, which indicates the assimilability of different racial types with the Nordish type, and the effects of their intermixture upon the Nordish type, the point or standard of reference is the Nordish race, and specifically its central and most distinct types. Other races would have entirely different scales of assimilability, with themselves as the point or standard of reference, i.e., the beginning numbers. For example, on a scale based on the Japanese people, the indigenous Japanese population would number perhaps 0-4, the Nordish racial types would likely measure in the 30s or 40s, or the mid-range numbers, and the West Africans would again be the highest numbers.
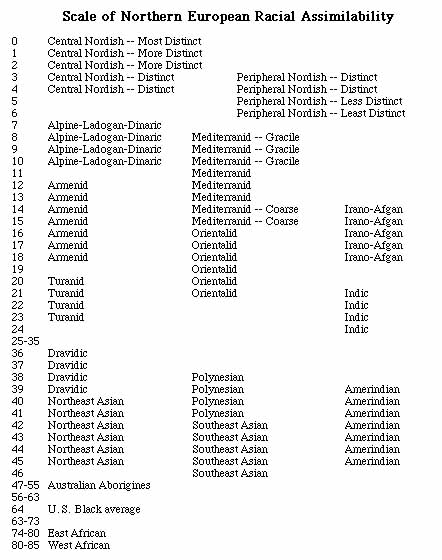
This scale begins with the most distinct Northern European or Nordish types, the Central Nordish types (Nordic, Fälish, Trønder, Brünn and Borreby) indigenous to northern Europe, ranging in distinctiveness from "0" to "4," with the most distinctly Nordish as "0" and the least as "4," and proceeds through the Peripheral Nordish types (Atlantid, East Baltic, Neo-Danubian, Sub-Nordic) who range from "3" to "6" in Nordish distinctiveness, through the various non-Nordish European types, to the various non-European Caucasian types, to the various non-Caucasian racial types. (See The Nordish Race for a more detailed description of the Nordish types)
This progression of assimilability (or unassimilability) coincides fairly closely, as one might expect, with the degree of racial or genetic distance of the various races from the Nordish race. If two or more different races are grouped closely together it is not an indication that they are racially closely related or similar, but only that they share a similar degree of assimilability with -- or racial distance from -- the Central Nordish racial types. Similarly, if two individuals share the same racial rating on this scale it does not indicate that they are necessarily of the same racial type, ancestry or group, only that they share the same degree of assimilability with -- or racial distance from -- the Nordish race.
The Mediterranid group ranges from 9-16 with the more "gracile" types being more assimilable for a Nordish population and the other types being less assimilable.
The Orientalid racial group consists of the "Arab" or "Semitic" populations of such countries as Syria, Jordan, Iraq and Saudi Arabia.
The Turanid group is the predominant element in Kazakhstan and is also common in Turkey.
The Indic group is the predominant racial type in Pakistan and northern India. The Dravidic group is the predominant racial element in the remainder of India.
The black population in the Americas is of the Palaecongoid and Sudanid subraces of West Africa. (See The Races of Humanity for a more detailed description of the non-Nordish races) Blood group studies have indicated that the U.S. black population is about 25% "white" in its genetic composition as a consequence of past intermixture. Assuming the racial average of the "white" element was a "4," this would place the U.S. black average at about "64" on this scale.
The dividing line between "white" and "nonwhite" is not as clear as it once was. In the United States before 1880 -- before the "new immigration" (1890-1924) added a large Mediterranid and Armenid element -- the population consisted almost exclusively of Northern Europeans and West Africans, and the racial designations of "white" and "black" referred to these two groups. For all practical purposes, and in popular usage, "white" was synonymous with Northern European. With the increase in the number of intermediate types there has been an expansion or inflation in the definition of "white" in its common usage to include a much broader range of racial types, many of which are quite racially distant from, and genetically incompatible with, the Nordish race. In current popular usage the dividing line on this scale between white and nonwhite would probably be in the 18-20 range. As a result, for purposes of Nordish racial preservationism the racial category of "white" is now clearly inadequate, since so many of those included in this category are far removed beyond what the Nordish race is capable of assimilating without losing its own racial identity. As presently defined the "white" race is not really a race, if a race is defined as a population that shares both a common biological ancestry and essentially similar, mutually compatible genetic traits which are not diminished or lost by within-group reproduction.
Racially mixed populations and individuals can range greatly over this scale. The racial average of mixed populations can be fairly accurately calculated based on their ancestral racial components, but the racial rating of mixed-race individuals can vary widely, although an average can be calculated. For example, one would expect the average racial rating of a quadroon (a person one-quarter black, with one black and three white grandparents) on this scale to be about "23" if the white grandparents had a racial average of "3" and the black grandparent were an unmixed West African rated at "83" (3+3+3+83 = 92. 92÷4 = 23). This would be outside the "white" racial range (see above). But Carleton Coon cites C. Stern to the effect that about 25% of quadroons can "pass" as "white." Given a quadroon racial average of "23" it can be expected that some would be rated in the 16-20 range, and able to pass as "white" when the "white" population extends to that range. In the U.S. before 1880, when the "white" racial range, with few exceptions, rarely extended beyond "9," it would have been much less common for a quadroon to "pass" as "white," and even octoroons (persons one-eighth black, with one black and seven white great-grandparents), with a racial average of "13," would have had difficulty doing so, as evidenced by the octoroon children of the quadroon Sally Hemings, alleged to have been fathered either by Thomas Jefferson or his nephew. Of course, if the single black grandparent of a quadroon was in fact part white, and rated at the modern U.S. black average of "64" on this scale, then the grandchild would be expected to rate near "18" (3+3+3+64 = 73. 73÷4 = 18.25).
In the United States blacks who rate above "40" on this scale (which would include most blacks who are half white in their genetic endowment) are generally perceived as simply black. Only when they rate below "40" is there a general perception that they are part white.
For purposes of reference, Colin Powell would rate about "35" on this scale. The late entertainer Sammy Davis, Jr. rated about "45," while his children by Swedish actress Mai Britt -- who rates at the most distinct Nordish level as a "1" -- rate as predicted by this scale in the 21-25 range. O.J. Simpson would rate about "55," while his children by his late wife Nicole, who rated about "4," would be expected to rate in the 29-30 range.
Given the laws of chance that govern genetic combinations in racial intermixture, individual exceptions to the rule are common. But as a rule mixed-race individuals conform closely to the results one would predict from this scale. For example, Nancy Kwan, an attractive "Chinese" actress of the 1950s and 1960s, was actually Eurasian, half Scottish (Nordish) and half Chinese (Northeast Asian), and rated about 23 on this scale, as one would predict. But Occidental movie-goers wrongly perceived her as a representative of pure Chinese womanhood, rather than the result of an equal European-Chinese mixture.
Some population groups are not racial groups, and consist of a mixture of individuals spread over a fairly broad racial range. Such groups, of racially mixed composition, are not defined in specifically racial terms and can only be placed on this scale in general terms. Such is the case with the Hispanic group. The Hispanic category covers almost the total racial range of this scale, but the great majority of the U.S. Hispanic population consists of Latin American Amerindians and Mestizos -- persons of mixed Amerindian and white (usually Mediterranid) ancestry. Even this more specific group, being still racially mixed, covers a broad racial range, from about "20" to "45." For purposes of calculation I place their average at "30."
Sample calculations using this scale to predict the effects of intermixture:
If the indigenous Nordish population of Sweden, which is rated at an average of "2" on this scale (see below) were to assimilate a West African element that was 1% of its own size -- which it outnumbered 100 to 1 -- its average would shift to 2.8, a very substantial racial change from being the most distinct of Nordish populations to being of only about average Central Nordish distinctiveness. A similar racial result would occur in the intermixture of a population that was 92% Swedish and 8% Mediterranid, with the average Mediterranid rating "12" on this scale, calculated as follows: 92% at "2" = 184 and 8% at "12" = 96. Add 184 + 96 = 280. Divide this by 100 and the resulting racial average is 2.8.
If the Swedish population assimilated a West African element that was 5% of the population, with the average West African rating "83," its racial average would change to 6, calculated as follows: 95% at "2" = 190 and 5% at "83" = 415. Add 190 + 415 = 605. Divide this by 100 and the resulting racial average is 6.05, a radical racial shift from being the most distinctively Nordish people to being borderline non-Nordish. A similar racial shift would occur in the intermixture of a population that was 60% Swedish and 40% Mediterranid, calculated as follows: 60% at "2" = 120 and 40% at "12" = 480. Add 120 + 480 = 600. Divide this by 100 and the resulting racial average is 6.
To take this sample series further, the mixture of a population that was 90% Swedish and 10% West African would result in a racial average of 10.1, calculated as follows: 90% at "2" = 180 and 10% at "83" = 830. Add 180 + 830 = 1,010. Divide this by 100 and the resulting racial average is 10.1. A similar racial average would result from the mixture of a population that was 20% Swedish and 80% Mediterranid, calculated as follows: 20% at "2" = 40 and 80% at "12" = 960. Add 40 + 960 = 1,000. Divide this by 100 and the resulting racial average is 10.
As should be evident from the above sample calculations, this scale teaches an important lesson -- for every degree of assimilation, however small it might seem, there are costs to be paid that are harmful to the preservation of the Nordish race and, if sufficiently large, actually destructive of the Nordish race. There is no getting around the numbers. They are inflexible and cannot be honestly evaded or denied.
The value of this scale to racial preservationists derives from the fact that when a population is composed of different racial elements it must be assumed that over time these elements will intermix or blend together, and the resulting mixed population will tend to increasingly cluster toward the mean, acquiring a growing uniformity around the racial average. In short, the racial average of a population is its racial destiny, its eventual racial future, predicting what the actual predominant racial type of the population will be after the process of intermixture has been completed. But due to global immigration patterns the racial average in many populations is not stable. This is especially true of many historically Nordish or part-Nordish populations, where immigration is causing them to shift ever further away from their indigenous racial average.
Scandinavia: As is universally recognized, the most distinctly Nordish populations are in Scandinavia. The totally Central Nordish indigenous population of Sweden, for example, would average about a "2" on this scale, calculated as follows: 15% of the population are "0s" = 0; 20% of the population are "1s" = 20; 30% are "2s" = 60; 20% are "3s" = 60; and 15% are "4s" = 60. Add these numbers together (0+20+60+60+60 = 200) and divide by 100 (for 100%) and the average is "2." The indigenous populations of Norway and Denmark would average about "2.2," with 10% "0s," 20% "1s," 30% "2s," 20% "3s" and 20% "4s." [See The Nordish Race for the racial composition of indigenous European populations]
When one takes into account the recent (post-1970) non-Nordish immigration into Scandinavia, and especially the racial composition of births, then the racial average of the population as of 1996 changes dramatically. For example, about 10% of the births in Sweden are to immigrants. If we assume that the assimilability of these immigrant newborns averages "40" (i.e., assuming there are about twice as many Caucasians among the immigrants than black Africans, while the remainder are Asian), then the racial composition of births in Sweden would be calculated as follows: 90% are "2s" (the indigenous Swedish births) = 180 and 10% are "40s" = 400. Add 180 + 400 = 580. Divide this by 100 and the racial average of Swedish births is currently about 5.8, a dramatic change from the indigenous population which has historically defined Nordish racial distinctiveness. The late physical anthropologist Carleton Coon called Sweden a refuge area for the classic Nordic racial type. This refuge area is now clearly endangered, as a "5.8" racial average is far removed from the classic Nordic type.
Britain: The Central Nordish element in the British population, not so distinctly Nordish on average as the Scandinavians, would average about a "3" on this scale, calculated as follows: 10% are "1s" = 10; 20% are "2s" = 40; 30% are "3s" = 90; and 40% are "4s" = 160. Add these numbers together (10+40+90+160 = 300) and divide by 100 and the average is "3." The average of the indigenous British Peripheral Nordish element would be about "5," calculated as follows: 10% are "3s" = 30; 20% are "4s" = 80; 30% are "5s" = 150; and 40% are "6s" = 240. Add these numbers together (30+80+150+240 = 500) and divide by 100 and the average is "5." The indigenous population of Britain as a whole would average about 3.66, calculated as follows: 67% are "3s" (the Central Nordish elements) = 201 and 33% are "5s" (the Peripheral Nordish elements) = 165. Add 201 + 165 = 366. Divide this by 100 and the average degree of Nordish distinctiveness of the indigenous British population is 3.66.
This again changes dramatically when the post-1955 non-Nordish immigrants into Britain and their descendants are considered, most noticeably in births, which together with immigration rates determine the racial composition of the future population. The non-indigenous elements are currently about 9% of the population. Assigning them an average assimilability rating of "50" (as the black proportion is larger than in Scandinavia) the present racial composition of Britain would be calculated as follows: 91% are "3.66s" (the average of the indigenous British element) = 333.06 and 9% are "50s" = 450. Add 333 + 450 = 783. Divide this by 100 and the British racial average is now about 7.83. Britain, which has been an exclusively and distinctly Nordish country since prehistoric times, now has a non-Nordish racial average. The racial average of the birthrate indicates that Britain will be even further removed from the Nordish type in the future. The non-indigenous elements account for about 14% of births, so the racial composition of births in Britain would be calculated as follows: 86% are "3.66s" (the average of the indigenous British births) = 314.76 and 14% are "50s" = 700. Add 315 + 700 = 1,015. Divide this by 100 and the racial average of British births is now about 10.15, which is about the same as Italy's.
Select groups within a population can vary substantially from the racial average of a population as a whole. In 1974 I visited the British aircraft carrier H.M.S. Hermes while it was serving as a Commando carrier (and while Prince Charles was assigned to it as a helicopter pilot). On board were a Royal Marine Commando of about 700 men, a battery of Royal Artillery of about 90 men, and a ship's company of about 1,000 Royal Navy officers and seamen. I was struck by the marked racial difference between the Royal Marines and the sailors, even when the clearly non-indigenous sailors were excluded. The Royal Marines were not only splendid examples of manhood, but on average much more distinctly Nordish than the sailors. On this scale I would place the Royal Marine racial average at "2.5," while the sailors would rate about "4." Obviously, some type of strong selection process was involved with these elite personnel beyond the expected one of physical conditioning. Similarly, when I visited the Norway pavilion at Epcot in May, 1988, just prior to its grand opening by the Norwegian Royal Family, I was impressed by the very high degree of Nordish racial distinctiveness of the young Norwegians staffing the pavilion at that time. Having visited Norway, I rate the Norwegian population as a whole at about "2.2" on this scale, but the very select group at the pavilion rated about "1.4." On subsequent visits to the pavilion I have found the staff to be more representative of the Norwegian population as a whole, a still very distinctly Nordish "2.2." It might also be noted that groups that are voluntary associations are often very selective, confirming the old adage that "Birds of a feather flock together," and can differ dramatically from the racial average of a population as a whole.
Germany: The racial distinctiveness of the Nordish population of Germany can be calculated as follows: 75% are "3s" (the average of the Central Nordish elements) = 225, and 25% are "5s" (the average of the Peripheral Nordish elements) = 125. Add 225 + 125 = 350. Divide this by 100 and the average degree of distinctiveness of the German Nordish population is 3.5. The racial average of the indigenous population of Germany as a whole would be calculated thus: 80% are "3.5s" (the Nordish elements) = 280 and 20% are "7.5s" (the average of the Alpine-Dinaric elements) = 150. Add 280 + 150 = 430. Divide this by 100 and the racial average of the entire indigenous German population is 4.3. When non-indigenous immigrant elements -- currently about 9% of the population -- are included, the racial average of the German population shifts as follows: 91% are "4.3s" (the average of the indigenous German element) = 391.3 and 9% are "30s" (the average of the immigrant element, which is mainly Turkish and Orientalid) = 270. Add 391 + 270 = 661. Divide this by 100 and the German racial average is now about 6.61, which is outside the Nordish range. As the immigrant element accounts for about 15% of births the racial average of births in Germany is currently about 8.15.
France: The distinctiveness of the Nordish population of France can be calculated as follows: 14% are "3s" (the average of the Central Nordish elements) = 42, and 86% are "5s" (the average of the Peripheral Nordish elements) = 430. Add 42 + 430 = 472. Divide this by 100 and the average degree of distinctiveness of the French Nordish population is 4.72, which is outside the Central Nordish range. The racial average of the indigenous population of France as a whole would be calculated thus: 35% are "4.72s" (the Nordish elements) = 165.2 and 65% are "8.5s" (the average of the Alpine-Dinaric-Mediterranid elements) = 552.5. Add 165.2 + 552.5 = 717.7. Divide this by 100 and the racial average of the entire indigenous French population is 7.18. When non-indigenous immigrant elements -- currently about 9% of the population -- are included, the racial average of the French population shifts as follows: 91% are "7.18s" (the average of the indigenous French element) = 653.38 and 9% are "50s" (the average of the immigrant element, which has a large proportion of black Africans) = 450. Add 653.4 + 450 = 1,103. Divide this by 100 and the racial average of the French population as a whole is now about 11. The immigrant elements account for about 14% of births, so the racial average of births in France is now about 13.17.
Individuals in the 1-2 range are very rare among the indigenous French population. Actresses Emmanuelle Beart and Julie Delpy would rate about "3" on this scale, while Catherine Deneuve, Leslie Caron and Brigitte Bardot would rate in the 4-6 range. While Mlle. Bardot, now of the elder generation, has supported the movement to preserve the French people by restricting and repatriating racially incompatible immigrants, Mlle. Beart, of the younger generation, has gained notoriety for her support of immigrant interests.
Italy: The position of the Italian population on this scale can be calculated as follows: 5% are "4.5s" (the average of the Nordish elements) = 22.5; 35% are "8s" (the average of the Alpine-Dinaric elements) = 280; and 60% are "12s" (the average of the Mediterranid elements) = 720. Add 22.5 + 280 + 720 = 1,022.5. Divide this by 100 and the racial average of the indigenous Italian population is 10.22.
In general, in recent years there has been a tendency among European countries to adopt more restrictive immigration policies, but racial preservationists should not draw too much comfort from this, for three reasons. First, this tendency has been more a response to high unemployment and other adverse economic factors than to any explicit racial preservationist sentiment. No doubt such sentiment exists and is a factor, but the anti-preservationist ideology of racial nihilism is still overwhelmingly dominant, and unless it is replaced by a new preservationist paradigm the immigrant influx into Europe, and its racially destructive consequences, can be expected to eventually return to, and even exceed, its previous levels. Second, the level of immigration into western Europe is still high, exceeding two million per year. Third, the immigrant elements currently present in the countries of northwestern Europe are already too large to be assimilated by the indigenous populations without effectively destroying their existing and historical racial identity. Only their removal from Europe -- preferably by their repatriation to their own countries of origin, their own racial homelands -- can prevent the destruction of the indigenous European populations.
When racially incompatible immigrants settle in a European country they change its racial average, and thereby its racial destiny or future. Immigrants (and the political, economic and cultural leadership that promotes or permits their entry) have dramatically changed the racial average of such Nordish countries as Britain and Sweden, thereby also changing the racial destiny of these countries from a Nordish future to a non-Nordish future, from a destiny that continued and preserved their indigenous Nordish populations to a destiny in which their indigenous populations are transformed and replaced by non-Nordish populations -- a racially non-British Britain and non-Swedish Sweden -- although the transformed populations might still identify themselves nationally as British and Swedish. A restoration of the indigenous racial average, restoring a Britain for the British and a Sweden for the Swedes, is required for the continuation and preservation, the future existence and destiny, of the indigenous British, Swedish and other Nordish peoples.
United States: The racial distinctiveness of the Nordish population of the United States can be calculated as follows: 65% are "3s" (the average of the Central Nordish elements) = 195, and 35% are "5s" (the average of the Peripheral Nordish elements) = 175. Add 195 + 175 = 370. Divide this by 100 and the average degree of distinctiveness of the U.S. Nordish population is 3.7. In his 1965 work The Living Races of Man Carleton Coon cites Glass and Li to the effect that the proportion of black genes in the American "white" population is negligible. Nearly all the gene flow between races from the intermixture of the last several centuries has been from the European races into the non-European races, and very little of the reverse has so far occurred (at least as of 1965). But there has been some assimilation of Alpine and Mediterranid genes by the American Nordish population, and this has caused their racial average to shift, reflecting a lessened degree of Nordish racial distinctiveness.
The racial average of the U.S. population as a whole on this scale (as of 1996) would be calculated thus: 57% are "3.7s" (the Nordish elements) = 210.9; 8% are "8s" (the average of the Alpine-Dinaric-Ladogan elements) = 64; 9% are "14s" (the average of the Mediterranid-Armenid-Orientalid elements) = 126; 9% are "30s" (the average of the Hispanic Amerindian-Mestizo elements) = 270; 13% are "64s" (the average of the black element) = 832; and 4% are "41s" (the average of the Asian and Amerindian elements) = 164. Add 211 + 64 + 126 + 270 + 832 + 164 = 1,667. Divide this by 100 and the racial average of the entire U.S. population is 16.67.
In this context it is interesting to note the new "Betty Crocker" brand symbol of General Mills. One advertisement highlights a picture of the new Betty with the phrase, "We look a lot like you." The previous or old Betty, in her many guises over a 70 year period, was always distinctly Northern European, rating in the 2-4 range on this scale. The new Betty, her replacement, is definitely not Northern European, although she looks like she could still be considered as borderline "white" according to the current common usage of the term. She looks, in fact, like a person who would be rated very near the current U.S. racial average of 16.67, a "multiracial, multiethnic composite" of what the typical American would look like after the diverse racial elements in the current population had been intermixed or blended together. [Betty_Crocker.jpg]
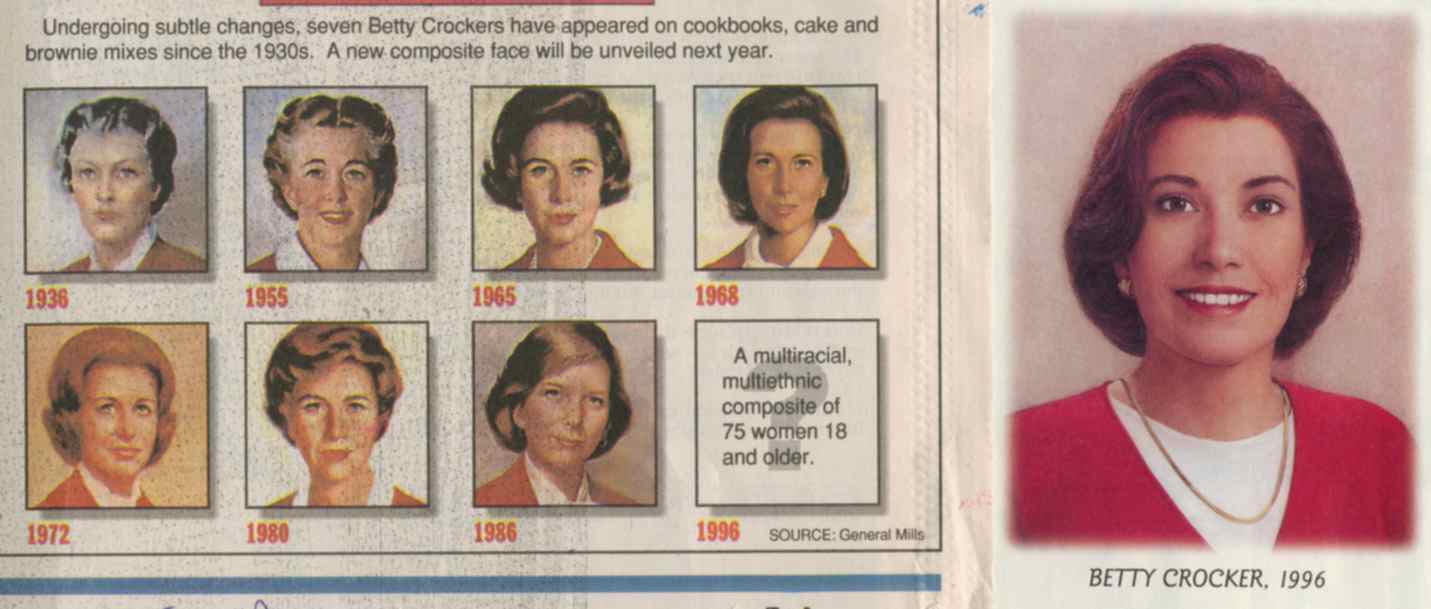
The new Betty would certainly not have been perceived as typically American by an earlier generation, but with the racial shift since 1970 -- especially the marked increase in intermediate racial types -- the perception of what is typically American is also shifting. The old Betty Crocker symbolized the blending or mixing of bakery ingredients. The new Betty Crocker symbolizes the blending or mixing of races. The racial average of a population is its racial destiny, the racial future. The new Betty Crocker is a symbol of our intended future. The racial destiny of the American population is to be "Betty Crockerized," its ingredients blended together toward the racial average, and cooked in the racial meltdown of the "melting pot."
Of course, the racial average of the U.S. population since 1970 has been in a state of continual transformation due to high levels of non-Nordish immigration and differential birthrates, so the 1996 racial average of 16.67 -- itself much higher than the 1970 average of 13.13, which had changed relatively little from the 1880 average of 12.68 [Note 1] -- is continually rising, or shifting ever further away from the Nordish racial range.
The racial average of current U.S. births clearly shows this continuing shift, and would be calculated as follows: 48% are "3.7s" (the Nordish elements) = 177.6; 8% are "8s" (the average of the Alpine-Dinaric-Ladogan elements) = 64; 9% are "14s" (the average of the Mediterranid-Armenid-Orientalid elements) = 126; 14% are "30s" (the average of the Hispanic Amerindian-Mestizo elements) = 420; 16% are "64s" (the average of the black element) = 1,024; and 5% are "41s" (the average of the Asian and Amerindian elements) = 205. Add 177.6 + 64 + 126 + 420 + 1,024 + 205 = 2,016.6. Divide this by 100 and the current (1996) racial average of U.S. births is 20.17, or outside the "white" racial range.
Projections for the U.S. population in the year 2050, combining the effects of both projected immigration rates and differential birthrates, result in a racial average that shows this shift even more clearly, calculated as follows: 37% would be "3.7s" (the Nordish elements) = 136.9; 6% would be "8s" (the Alpine-Dinaric-Ladogan elements) = 48; 10% would be "14s" (the Mediterranid-Armenid-Orientalid elements) = 140; 21% would be "30s" (the Hispanic Amerindian-Mestizo elements) = 630; 16% would be "64s" (the black element) = 1,024; and 11% would be "41s" (the Asian and Amerindian elements) = 451. Add 136.9 + 48 + 140 + 630 + 1,024 + 451 = 2,429.9. Divide this by 100 and the racial average of the entire U.S. population in 2050 would be 24.3, an 80% increase from 1996 in the distance of the racial average from the Nordish range.
The racial average of projected births in the U.S. in 2050 shows the racial change still more dramatically, calculated as follows: 27% would be "3.7s" (the Nordish elements) = 99.9; 4% would be "8s" (the Alpine-Dinaric-Ladogan elements) = 32; 9% would be "14s" (the Mediterranid-Armenid-Orientalid elements) = 126; 26% would be "30s" (the Hispanic Amerindian-Mestizo elements) = 780; 21% would be "64s" (the black element) = 1,344; and 11% would be "41s" (the Asian and Amerindian elements) = 451. Add 99.9 + 32 + 126 + 780 + 1,344 + 451 = 2,832.9. Divide this by 100 and the racial average of U.S. births in 2050 would be 28.33. This is near the current racial average of the population of Mexico.
This racial average, or one shifting continually higher or further away from the Nordish range, will eventually be our racial destiny, our racial future, the fate of our race, unless measures are taken to prevent it. If we want a different racial future we must change the racial average to give us the racial future we want. If we want our racial future to be Nordish, to preserve the racial identity of our past and present generations, we must partition the country into separate racial nations, including a Nordish nation with a population whose racial average is within the Nordish range.
The racial average of a separate "white" nation which included the entire U.S. "white" population (basically all persons in the 1-19 range on this scale) would be calculated as follows: 77% would be "3.7s" (the Nordish elements) = 284.9; 11% would be "8s" (the Alpine-Dinaric-Ladogan elements) = 88; and 12% would be "14s" (the Mediterranid-Armenid-Orientalid elements) = 168. Add 285 + 88 + 168 = 541. Divide this by 100 and the racial average of the population in the separate "white" nation would be 5.41. This would be a racial average just barely within the Nordish racial range and well outside the Central Nordish range, similar to the racial average of Poland (5.6) or Austria (5.95). With an average this far removed from the more distinct part of the Nordish racial range it is unlikely that the most distinct Nordish elements in the 0-2 range would be fully preserved in the long-term. Certainly they would become very rare. (In 1880 the racial average of the U.S. "white" population was a distinctly Nordish 3.69. In 1970 it was about 5.16. [Note 2] The shift occurred mainly during the "New Immigration" of 1890-1924, which was ended by the passage of the National Origins Act in the latter year. The racial average of immigration into the U.S. before 1880 -- excluding African slaves -- was a distinctly Nordish 3.72. During the New Immigration from 1890-1924 it was about 8.5. Since 1970 it has been about 35.)
To fully preserve the most distinct Nordish elements a racial average closer to the center of the Nordish racial range is required. Toward this end I have proposed a preservationist plan for partition [see The Preservationist Alternative] which would divide the "white" elements of the U.S. population into two separate racial nations. The population in the separate Nordish nation would consist of those persons in the 0-10 range on this scale. This would include the Nordish, Alpine-Dinaric-Ladogan and gracile Mediterranid elements, but exclude the other "white" elements in the 11 and over range, who would have their own separate nation. The racial average of the separate Nordish nation in my proposal would be calculated as follows: 83.4% would be "3.7s" (the Nordish elements) = 308.58; 12.6% would be "8s" (the Alpine-Dinaric-Ladogan elements) = 100.8; and 4% would be "9.5s" (the average of the gracile Mediterranid elements) = 38. Add 308.58 + 100.8 + 38 = 447.38. Divide this by 100 and the racial average of the population would be 4.47, well within the Nordish racial range as a whole, although just outside the Central Nordish range. This would be a racial average which could preserve the full range of the Nordish race, including the elements in the very distinct 0-2 range.
For racial preservationists in general, and Nordish preservationists is particular, this is the racial average that should be our goal, the one we should be moving toward, the one that will preserve the Nordish race.
Return to Racial Compact main page